Now that is one heck of a name for a blog post! The new C9136 access point from Cisco does not only have Wi-Fi radios, that we knew. It has Zigbee and Bluetooth, but did you know it also has environment sensors to measure things like temperature, humidity and it also has a TVOC sensor.
In this blog post I will show you what happens when you fart on this AP. Yes – you read that correctly. I did that to show my kid what this AP can do, and what streaming telemetry is all about.
Before looking at what happened, let us look at what kind of data we can get.
The environmental sensors
The easiest way to see what kind of data you can get from a C9800 is to look in the yang models. Below I have used the Netconf Explorer to see what kind of data I could get from the sensors from my 9136 APs. Below you see the ap-air-quality from the access-point-oper-data yang model.
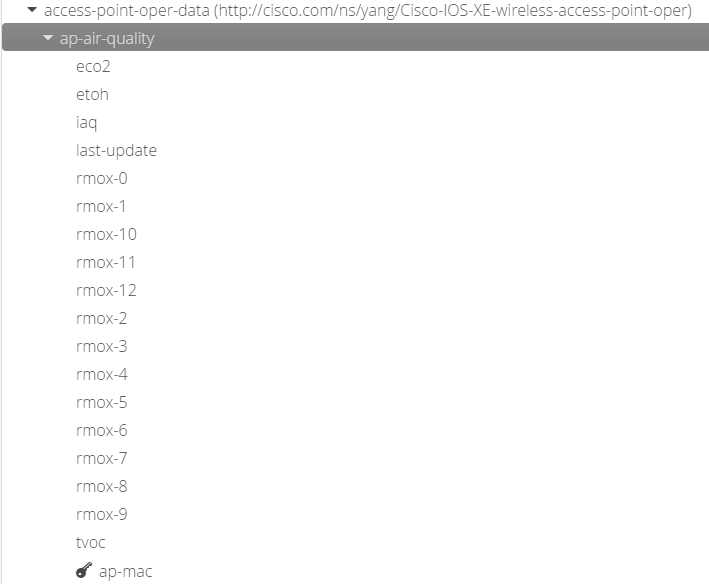
The description for each I have given below, if you want to learn more just look at air-quality blogs on google. Here is a good one https://www.breeze-technologies.de/blog/calculating-an-actionable-indoor-air-quality-index/
EDIT: Thanks to Richard Atkin (@UKRichA on Twitter) he told me that this document Overview of TVOC and Indoor Air Quality – White Paper is what Cisco shares in DNAS for the sensors. Thank you! Have a look at his blog here about WiFi, Security & Serverless. https://richardatkin.com/
- eco2 – Estimated carbon dioxide
- eco2 has been removed in 17.8.1, since the AP never had such a sensor.
- etoh – Ethanol alcohol concentration
- iaq – Indoor air quality index
- rmox 0 – 12 – Raw metal-oxide resistance
- tvoc – Total volatile organic components
These next values do not need any description, temp and humidity.
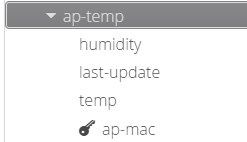
The sensor updates every 5s, but you can change that to a higher value but not to a lower value.
To enable the sensors you type the following commands.
conf t
!
ap profile your-ap-profile
 sensor environment air-quality
 sensor environment temperature
If it does not work, try to un-shut the sensor
ap name ap-name no sensor environment air-quality shutdown
ap name ap-name no sensor environment temperature shutdown
Farting on the AP
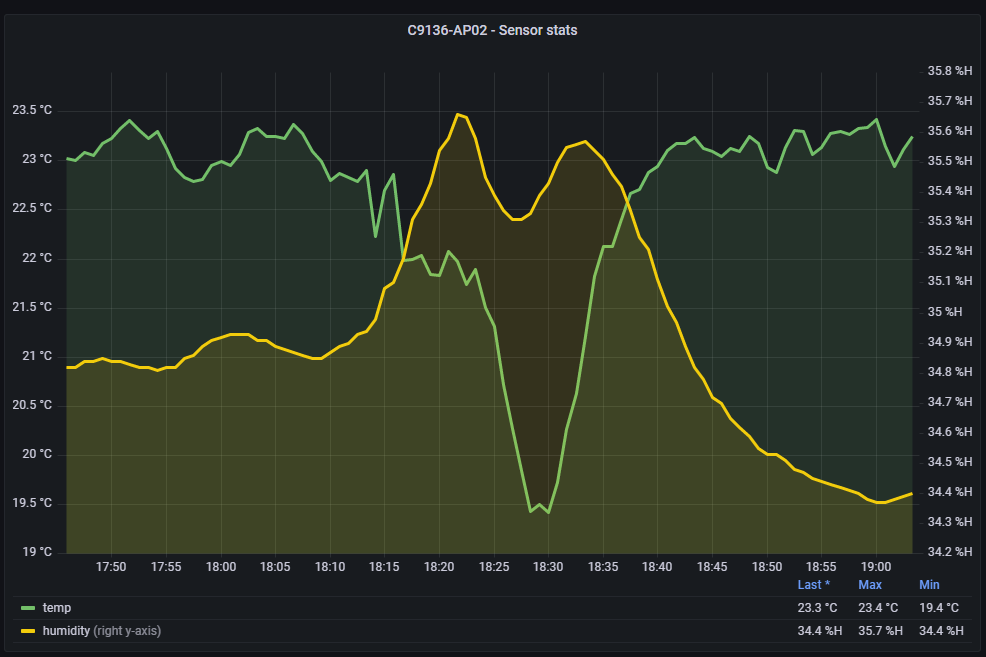
Now, I am pretty amazed that you read this far. Below you can see what happened. The Air-Quality Index went to a record high since I turned the sensors on to value of 4. (whatever 4 means, I called it Moderate). The TVOC and ETOH sensor got a big jump, and the humidity went up a little bit. It was not a strong fart, so your fart could make this graph more dramatic.
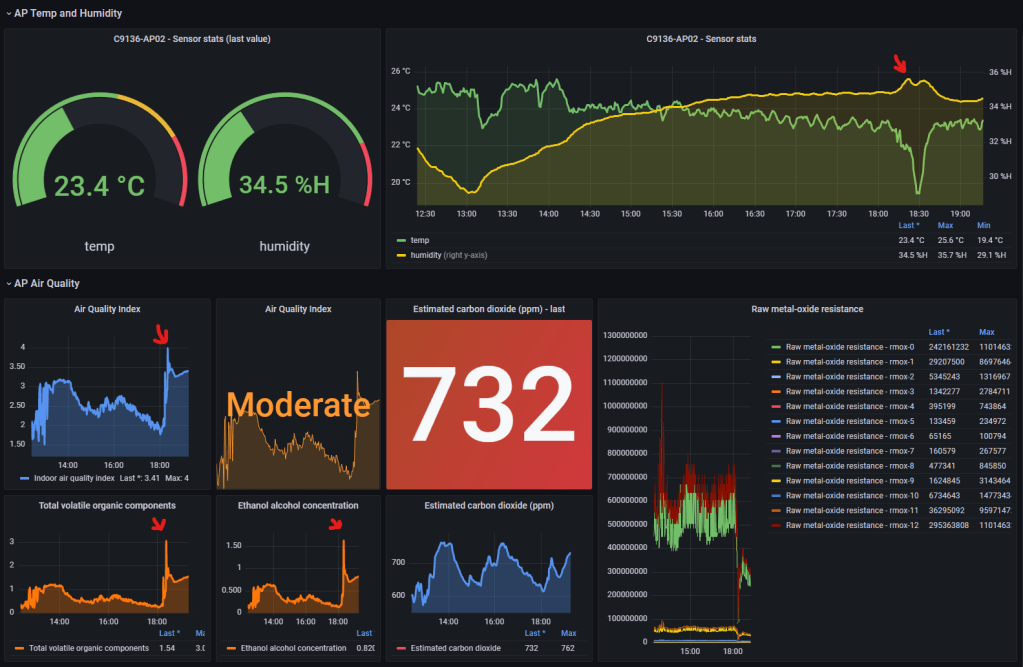
Look at the red arrows, there you can see how all the different values went up after the next update (5 seconds after the fart and laughs)
If you look closely you can see it drops pretty quick after the fart. Why do you think that? Well, we had to open up the window! See the temperature falling? 🙂
Now, before we go any further, just think about it a bit. We place APs in meeting rooms and offices for reason, you can now monitor if you boss farts! Now that is a cool future!
Now we can not only monitor where users are, how long there were there, what AP they were joined to, where they walked, what they did, but now also IF THEY FARTED. I can now create a Slack bot that sends a message to my Slack channel whenever the AQI goes up, then I can see how many clients was joined to that AP and where it is and WHO was there…. or just use this data to see if the air quality is so bad is messes up with peoples cognitive abilities.
Let us take a closer look at what happened.
A closer look…
On this next picture I have changed the time of exactly when the update after the fart was dealt to the AP. You can see the graphs going up pretty quick after the fart. I have used a shared tooltip in Grafana to get the values shown for all panels in my sensor dashboard.
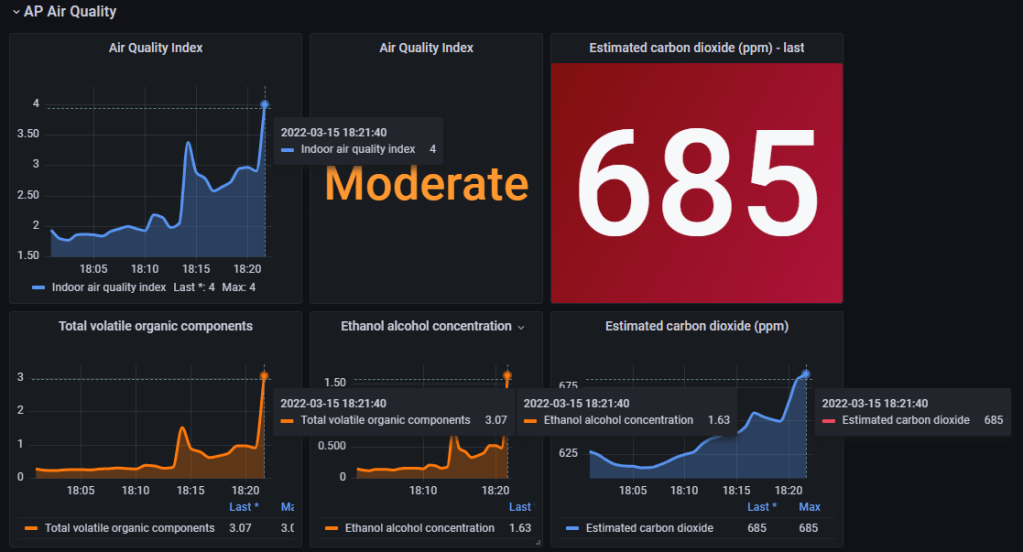
And here is the temp and humidity, where you see a bit of a rise in humidity and then right after a drop in temperature and humidity. Why is that? Because we had opened up the window!!
If you take a look on the first picture, you can also see that the AQI went down pretty quick after opening up the window, so did all the other sensors.
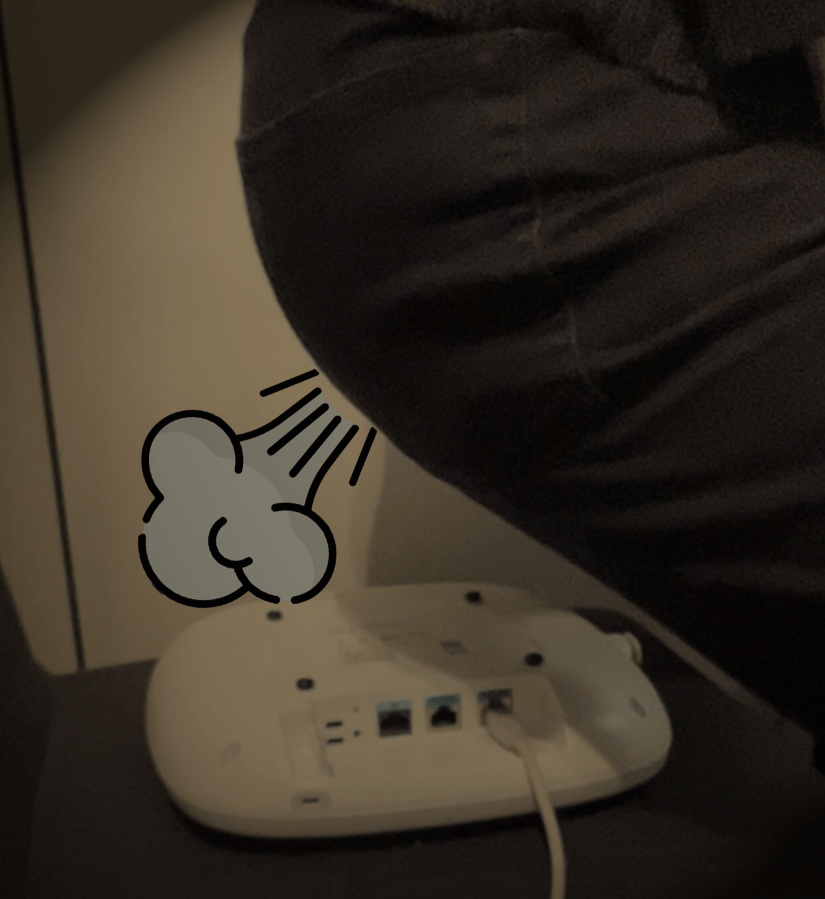
Do you want to test farting on a C9136? The sensors are most sensitive when placed like this. Eat some strong food, and try it out (or not, because I did it for you)
Hope you liked this blog, my name is Kjetil and I like to test stuff!
If you want to learn how to build things like this, then I do have a course at wifitraining – Streaming Telemetry w/Cisco 9800 or if you like reading you can take a look at Dave Benham’s blog post here – Viewing Network Telemetry from the Catalyst 9800 with Grafana
#C9136 #CiscoChampion #sensor #telemetry

Amazing post! Thank you for sharing what this AP (and others like it) can do. My office will never be the same!
LikerLikt av 1 person
Very cool indeed, thanks! I don’t know why I can’t change all the APs at the office to 9136 or 9166.
Add this with some other telemetry data, then you know way more than you need to.
LikerLiker